


TL;DR
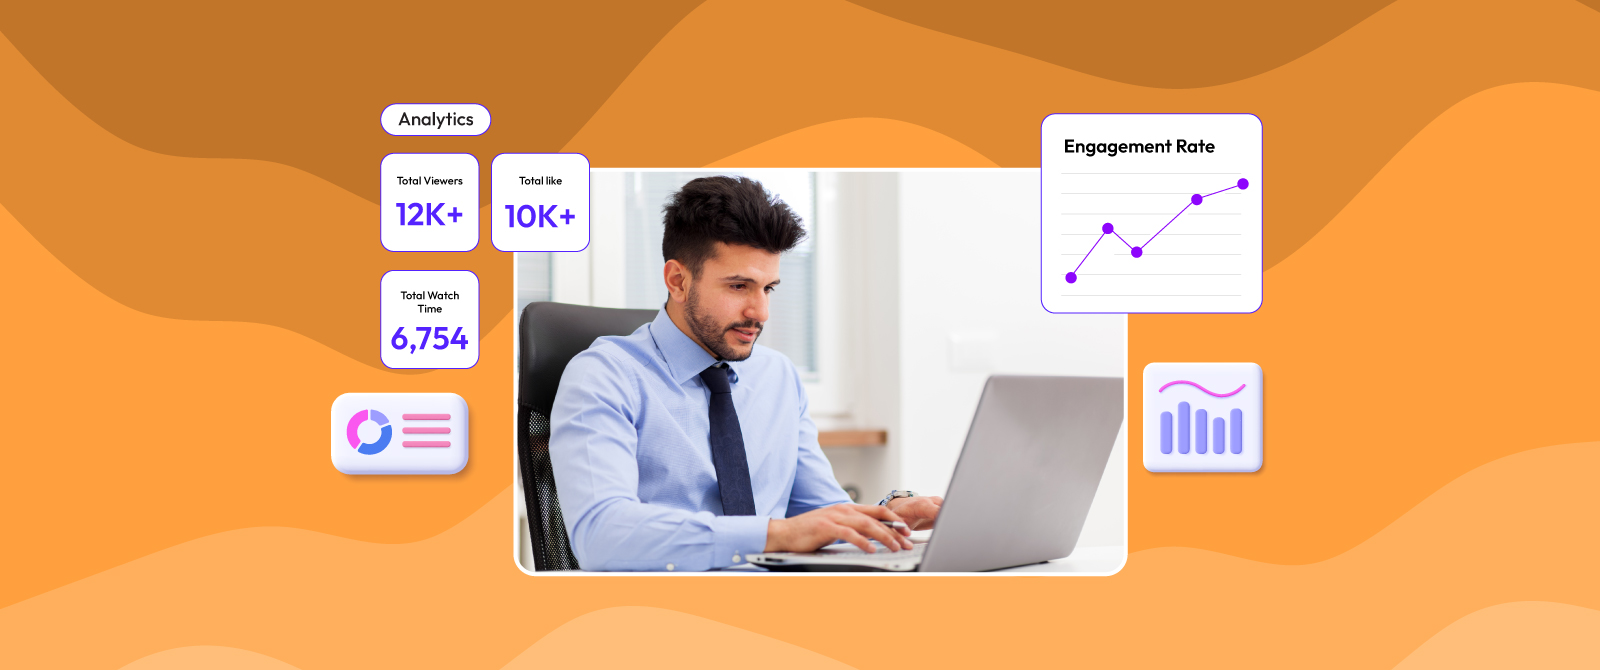
Tracking the KPIs of live streaming through analytics has become essential for modern events. By monitoring metrics such as total viewers, engagement rate, audience retention, average watch time, peak concurrent viewers, stream quality, and registration-to-attendance rate, event organizers can understand audience behavior, improve attendee experiences, and maximize event ROI.
Introduction
As per a 2025 systematic review by ResearchGate, it has been found that live streaming in events has become an integral part of conferences, festivals, and hybrid events, with engagement analytics playing a central role in evaluating event performance, making it an essential part of modern event management rather than just an optional add-on.
If you are curious about how live streaming is contributing to the success of live events, you should definitely give Live Streaming for B2B Events in Dubai: Unlocking New Opportunities a read.
But only live streaming events aren’t enough anymore, without having answers to questions such as: How many people watched the event? Or which sessions attracted the most viewers? You miss out on crucial information required to determine the success of your virtual and hybrid event. This is where having live streaming analytics makes a difference; the metrics obtained will help you measure audience engagement, identify technical issues, evaluate content performance, and make data-driven decisions for future events.
This blog brings to you the top seven key performance indicators of live streaming that every event organizer should track to gain measurable insights that will improve both the attendee experience and ROI of your events.
Top 7 Key Performance Indicators of Live Streaming
Let’s see what the top 7 key performance indicators of live streaming are and how they support organizers in evaluating their live event’s performance and reach in real-time.
1. Total Viewers
One of the first things you should ask your live streaming company is the total number of viewers watching your live stream.
The Metrics: Measures the number of unique viewers who watched your live stream.
Why It Matters: Reviewing the total viewers of your live stream indicates the overall reach of your event and the effectiveness of your promotional efforts.
For tips on how to increase your viewers, you can read 14 Ways to Increase Event Live Streaming Viewers.
2. Peak Concurrent Viewers

If you want to evaluate the streaming infrastructure of your live streaming service provider and the quality of your content, apart from the hook, then this is one of the metrics that can give you a clear picture of it.
The Metrics: Tracks the highest number of viewers watching the stream simultaneously.
Why It Matters: Analyzing peak concurrent viewers helps event organizers identify the most popular sessions and ensures your streaming infrastructure can handle peak traffic.
3. Average Watch Time
Your content is more important than it seems when you are hosting live events, making average watch time an essential KPI to track for live streaming.
The Metrics: Measures how long viewers stay connected to your live stream.
Why It Matters: Measuring average watch time helps determine whether your content is engaging enough to keep the viewers watching. Shorter watch time might indicate that the content needs improvement, while a longer watch time suggests quality content in most cases.
4. Audience Retention Rate
The success of live streaming events largely depends on how well you bridge the gap between the content format your audience wants to consume and the one you are streaming. In fact, a study analyzing 12,156 YouTube live streams found that shorter streams consistently attracted larger and more stable audiences than longer broadcasts.
The Metrics: Shows the percentage of viewers who continue watching throughout the event or session.
Why It Matters: Tracking the audience retention rate helps identify where viewers lose interest, allowing you to improve future content and session formats.
Connect with the Industry's Most Experienced
Live Streaming Service Providers.
5. Engagement Rate
Industry reports show 56% of event professionals now measure attendee engagement as a key success metric, alongside attendance and ROI, so not tracking the engagement rate means missing out on an industry standard.
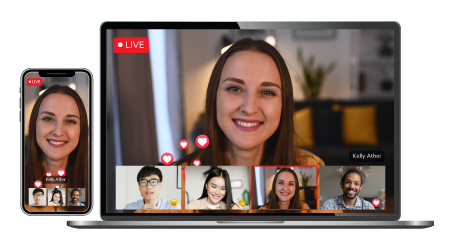
The Metrics: Measures how actively viewers interact with the stream through live chat, polls, Q&A, reactions, and comments.
Why It Matters: When you access the engagement rate, you get to understand how your audience is interacting with your event. If you find the engagement rate to be high, it indicates that attendees are actively participating rather than passively watching.
6. Stream Quality Metrics
The global live streaming market is projected to grow at a CAGR of 16.6% between 2025 and 2029. So, if you are planning to track your streams, then having a robust streaming infrastructure that delivers a consistent viewing experience during peak traffic is as important as the right live streaming service provider.
The Metrics: Monitors technical performance indicators such as buffering rate, playback failures, video start time, bitrate stability, and stream interruptions.
Why It Matters: Overseeing the stream quality metrics ensures a smooth viewing experience, reduces drop-offs, and improves attendee satisfaction.
Related Read: LIVE Streaming – Tips & Ideas to Ensure a Seamless Broadcast
7. Registration-to-Attendance Rate

You could have 15,000 attendee records in your registration database, but do each one of them turn up at the time of streaming? That’s a question the registration-to-attendance rate is meant to answer.
The Metrics: Calculates the percentage of registered attendees who actually joined the live event.
Why It Matters: Monitoring registration-to-attendance rate measures how effectively your event converts registrations into actual participation.
Conclusion
To conclude, live streaming analytics is no longer optional; it’s essential for delivering successful virtual and hybrid events. By understanding your audience’s behavior through the above-mentioned key performance indicators of live streaming, you can be better prepared for live events in the future, which will measure the audience engagement, retention rates, conversion rates, number of viewers, average watch time of your event, and the content quality.
FAQs
Live streaming analytics is the process of collecting and analyzing data from a live-streamed event, such as viewer count, watch time, engagement, audience retention, and stream quality. These insights help organizers evaluate event performance and make informed decisions for future events.
The most important KPIs include:
Total Viewers
Peak Concurrent Viewers
Average Watch Time
Audience Retention Rate
Engagement Rate
Stream Quality Metrics
Registration-to-Attendance Rate
While total viewers measure your event’s reach, audience retention shows how long attendees remain engaged. High retention usually indicates that your content is valuable and relevant to your audience.
Analytics reveal which sessions perform best, where viewers disengage, and how attendees interact with your event. These insights help optimize future content, improve attendee satisfaction, and provide better value to sponsors, ultimately increasing event ROI.
Stream quality metrics measure the technical health of a live stream. They include buffering rate, playback failures, video start time, bitrate stability, latency, and stream interruptions, helping organizers deliver a smooth viewing experience.
A professional live streaming service provider offers real-time dashboards and post-event reports that track viewer behavior, engagement, technical performance, and attendance metrics, enabling organizers to make data-driven improvements.
This metric shows how many registered attendees actually joined your event. It helps evaluate the effectiveness of your marketing campaigns, reminder emails, and audience interest while identifying opportunities to improve attendance at future events.
Organizers should monitor analytics during the event to quickly resolve technical issues and review detailed post-event reports afterward. Comparing analytics across multiple events also helps identify long-term trends and continuously improve future live streams.